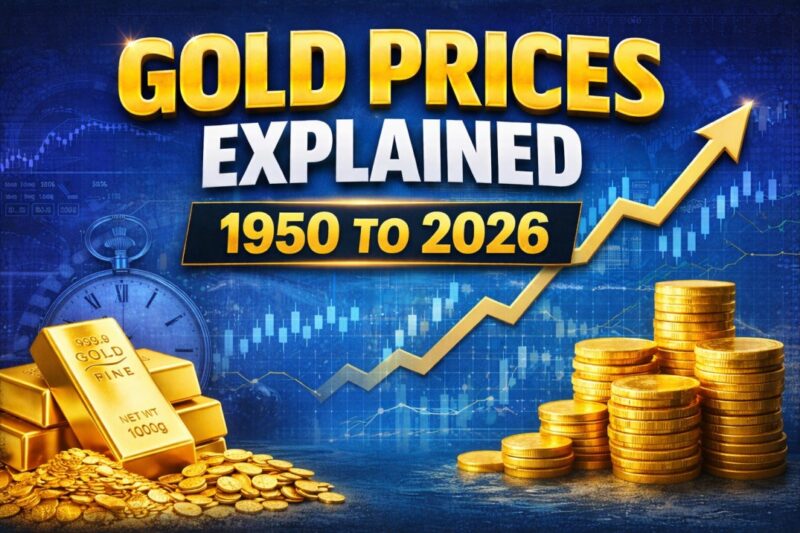
Gold Prices Explained: How Gold Evolved from 1950 to 2026
If you’ve been keeping a close eye on the gold prices, they are rising fast. In early 2026, gold reached a huge increase of up to $4,800 per ounce.
At the same time, the gold price in India passed ₹1,52,500 for 10 grams, which is a huge 10% jump this year. The graph is still not stopping, and the prices are hitting new records.
The new record of increasing gold prices is happening because people are looking for a safe place for money during tough global times. In order to understand it better, let’s go back and visualize how the gold price has changed over the past 75 years.
Historical Gold Price Table (1950–2026)
| Year | Price Per Ounce (USD) | Price Per 10g (INR) | Source Proof |
| 1950 | $34.72 | ₹99 | Reference |
| 1960 | $35.27 | ₹112 | Reference |
| 1970 | $35.96 | ₹184 | Reference |
| 1980 | $615.00 | ₹1,330 | Reference |
| 1990 | $383.51 | ₹3,200 | Reference |
| 2000 | $279.11 | ₹4,400 | Reference |
| 2010 | $1,224.53 | ₹18,500 | Reference |
| 2020 | $1,769.59 | ₹48,651 | Reference |
| 2026 | $4,800.00 | ₹1,52,500 | Reference |
What Actually Affects Gold Prices Over the Years
| Factor | What Happens | Gold Price |
| Inflation | Money loses value | Goes Up |
| Interest Rates | Bank rate cuts | Goes Up |
| Global Impact | Wars or trade fights | Goes Up |
| Central Banks | Big banks buy more | Moves Fast |
1950-1967: When Gold Prices Were Fixed and Rarely Changed
Gold prices have remained stable in recent years with rare movement. As per the special plan of the Bretton Woods system after World War II, the gold was kept at $35 per ounce. Since the government set a fixed price instead of open markets, there was no impact of demand on the price.
1968-1971: Problems Begin in the Fixed Gold Price System
By the late 1960s, the rise in inflation and trade imbalances made it really difficult to keep the gold prices fixed. Some nations started trading gold at their own prices instead of following official rules. By the end of 1971, the fixed gold price system came to an end.
1971: The Year Gold Started Trading Freely
In 1971, the United States stopped allowing people to trade dollars for gold. Since the gold price was moving according to sellers and buyers, this decision changed the entire way. It opened a new way to decide the gold’s worth, i.e., via the market.
1972-1980: High Inflation Drives Gold Prices Sharply Higher
Once the gold price was taken over by the market, the gold price rose high. In the period of high inflation, people started buying gold for safety. This created one of the biggest price rises for gold and caught investors’ attention, too.
1981-1999: Gold Stays Quiet
Gold prices remained flatlined for 20 years, with investors choosing stocks over gold.
2000 – 2007: Gold Slowly Gains Attention Again
Concerns about debt and markets slowly brought gold back. Prices didn’t jump yet, but started a steady and upward climb.
2008-2011: Financial Crisis Pushes Gold to New Highs
The 2008 financial crisis changed everything for investors. With banks struggling and global markets feeling unsafe, people rushed to buy gold to save themselves from financial system failure.
2012-2015: Gold Prices Cool as Markets Stabilize
Once the world economy started to recover from 2008, gold prices stopped rising so quickly. People started getting attracted towards stock investment, making these years stable for gold.
2016-2019: Gold Holds Steady During Political and Trade Tensions
Between 2016 and 2019, the gold prices remained constant because of trade fights and global risks. In between global and geopolitical tensions, investors chose to invest in gold.
2020: Pandemic Shock Sends Gold Prices to Record Levels
The COVID-19 pandemic led to uncertainty in gold prices, with businesses getting shut down and the government spending on people’s lives. Since the economy was down, people moved to invest in gold for safety.
2021 – 2022: Inflation and Interest Rates Pull Gold in Opposite Directions
With rising daily goods costs in 2021, gold was a popular choice for protection, and banks raised interest rates to stop these rising costs. Both forces kept the gold piece strong with little jump and downfall.
2023 – 2024: Central Banks and Global Conflicts Support Gold Prices
Gold prices kept rising during these years as major central banks purchased a lot of gold to maintain strong reserves. At the same time, global conflicts have led people to purchase gold as a safe investment.
2025-2026: Where Gold Prices Stand Today
Gold’s growth in 2025 was the best till now, as many reports claim that it climbed around 65% because of lower interest and global risks. In the current year, 2026, it keeps rising.
What This 75-Year Timeline Shows About Gold Price Behavior
| When This Happens | Gold Prices Usually |
| Prices rise or things feel unsafe | Rise fast |
| The economy is steady and interest rates are high | Stay low or move slowly |
| Governments change big money rules | Make the biggest moves |
Conclusion
Hence, gold has come a long way from fixed prices (1950) to a record high of $4,800 today. The price shift clearly highlights how the world economy and buyer habits lead to a rise in gold prices.
Important Links –
https://www.macrotrends.net/1333/historical-gold-prices-100-year-chart
https://www.forbesindia.com/article/explainers/gold-rate-history-india/92539/1
https://in.investing.com/news/commodities-news/can-gold-reach-new-highs-in-2026-5174846
For More Information: Download Stockyaari App Now
Standard warning: “Investment in securities market are subject to market risks. Read all the related documents carefully before investing.” Disclaimers: a. “Registration granted by SEBI, enlistment as RA with Exchange and certification from NISM in no way guarantee performance of the intermediary or provide any assurance of returns to investors.” b. “The securities quoted are for illustration only and are not recommendatory.”
This analysis is for informational purposes only. Please consult a SEBI-registered financial advisor before investing.
– Chandan Pathak
Equity Research Analyst, StockYaari