How to Read Stock Market Live Screen: Price, Volume, Bid, Ask Explained
If you have checked out the stock market screen, the numbers seem to be moving pretty fast. Be it prices, trading volumes, and buy levels (bid) and sell levels (ask), everything keeps moving constantly. For instance, just this week, foreign investors sold over $900 million in a single day. With all this quick movement of numbers, anyone can get confused with handy knowledge.
Last Traded Price (LTP)
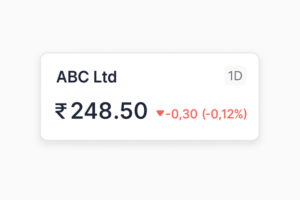
The number you see most on the screen is the Last Traded Price (LTP). In simple words, every time a trade happens ( buyers and sellers agree on a price), the number gets updated. For busy stocks, the LTP change can be visible multiple times in just a second, while the same might not move for several minutes for quieter stocks.
Here is a simple example from a live screen:
| Time | Price (₹) | Change Vs Previous Trade |
| 10:15:02 | 248.20 | — |
| 10:15:03 | 248.50 | +0.30 |
| 10:15:04 | 248.35 | -0.15 |
Volume on the Live Screen
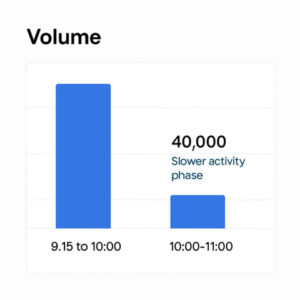
Volume on the stock screen indicates the activity of the stock during ongoing trade. With the volume bar spiking up, many traders will be participating in the trade. Similarly, the small bar shows little or no activity for the stock.
Example of reading session volume on a screen:
| Time Range | Volume Traded | What It Means on the Screen |
| 9:15 to 10:00 | 1,20,000 | Strong early participation |
| 10:00 to 11:00 | 40,000 | Slower activity phase |
Bid Price
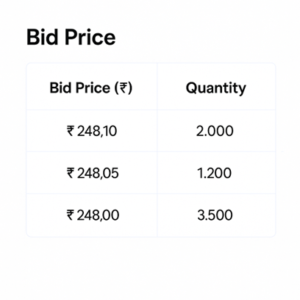
The bid price on the stock screen highlights what buyers are willing to pay right now. Going by the name, the highest bid goes straight to the top, while lower bids remain at the bottom.
If the bid price keeps moving up, it is a signal that buyers are quickly trying to get more competitive. On the other hand, if the top bid remains intact and trade happens at lower prices, it means that buyers are stepping back.
Example bid panel:
| Bid Price (₹) | Quantity |
| 248.10 | 2,000 |
| 248.05 | 1,200 |
| 248.00 | 3,500 |
Ask Price
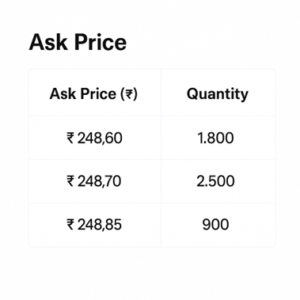
The ask price on the stock screen shows what sellers are expecting to be paid. The first level shows the lowest ask, followed by higher asks.
If the bottom ask keeps lowering, sellers are likely to match fast buyers. On the other hand, if the ask level bounces up, it signals that the stock is getting stronger interest.
Example data for ask panel:
| Ask Price (₹) | Quantity |
| 248.60 | 1,800 |
| 248.70 | 2,500 |
| 248.85 | 900 |
Bid-Ask Spread
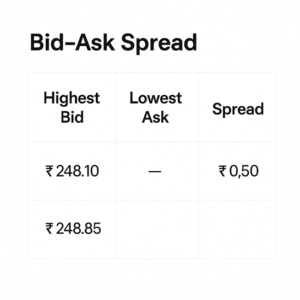
Bid Ask Spread is the difference between the highest price buyers (Highest Bid) and the lowest price sellers (Lowest Ask). This difference highlights the ease of completing a trade and how quickly an order might match.
Example data screen:
| Highest Bid | Lowest Ask | Spread |
| ₹248.10 | ₹248.60 | ₹0.50 |
Market Depth
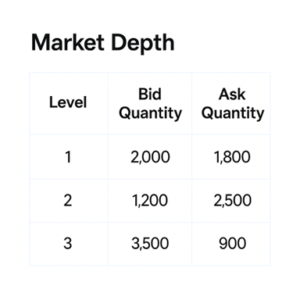
Market depth allows you to keep a keen eye on multiple layers of buy (bid) and sell (ask) waiting orders. In case many orders are grouped at a price, a lot of people are waiting there.
A big order vanishing highlights that it was cancelled. On the other hand, if a new big order appears, new interest is likely to arrive.
Example data snapshot:
| Level | Bid Quantity | Ask Quantity |
| 1 | 2,000 | 1,800 |
| 2 | 1,200 | 2,500 |
| 3 | 3,500 | 900 |
Tick by Tick Trades
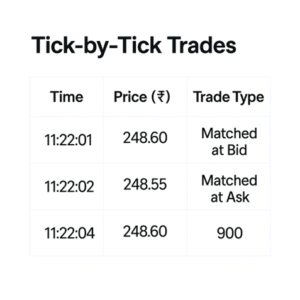
Tick-by-tick data highlights each and every single trade happening in real time. It showcases the exact price and trade category along with the participants being aggressive buyers (hitting the Ask) or aggressive sellers (hitting the Bid).
Example screen:
| Time | Price (₹) | Trade Type |
| 11:22:01 | 248.60 | Matched at Ask |
| 11:22:02 | 248.55 | Matched at Bid |
| 11:22:04 | 248.60 | Matched at Ask |
Conclusion
Once you’re aware of what those juggling numbers mean on the stock market screen, it becomes easy to understand the terms and their impact. The proper understanding of price ticks, volume shifts, bid-ask levels, market depth, and more will provide clarity and confidence.
For More Information: Download Stockyaari App Now
Standard warning: “Investment in securities market are subject to market risks. Read all the related documents carefully before investing.” Disclaimers: a. “Registration granted by SEBI, enlistment as RA with Exchange and certification from NISM in no way guarantee performance of the intermediary or provide any assurance of returns to investors.” b. “The securities quoted are for illustration only and are not recommendatory.”
This analysis is for informational purposes only. Please consult a SEBI-registered financial advisor before investing.
– Chandan Pathak
Equity Research Analyst, StockYaari