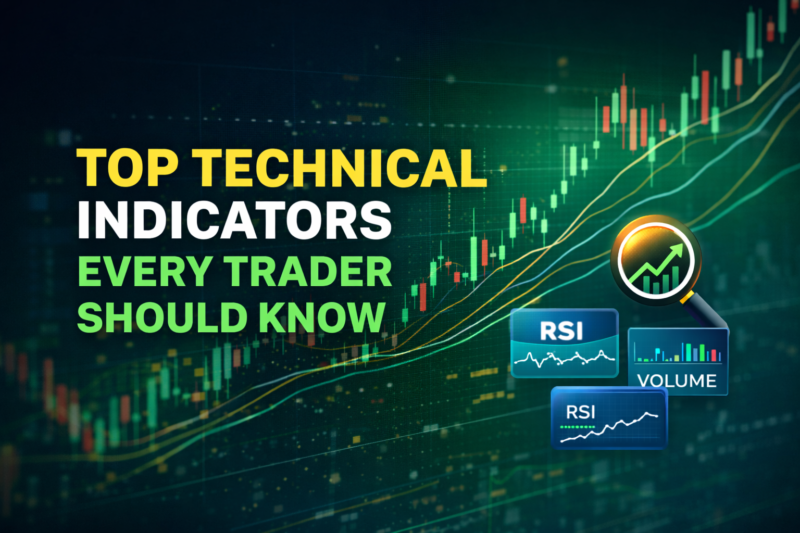
Top Technical Indicators Every Trader Should Know
When we look at the stock chart, there will be prices moving up and down without any mention of reason. Anyone new to stock trading or unaware of technical indicators can read the movement wrong. Technical indicators in the stock market play an important role in understanding trend, momentum, activity, and price behavior.
As per a report in October 2025, 1 in 5 registered investors actively traded, highlighting the interaction with the indicators or analysis tools. These tools are really helpful in the past movement of prices and current behavior for a better understanding.
Moving Averages (SMA and EMA)
Moving averages clear the main direction of the stock price. SMA and EMA avoid the distraction from the small price movements. These lines simplify the visual understanding of a messy price chart.
SMA uses all old prices to calculate the average and provide one equal value. EMA responds very quickly based on the recent prices.
For example, if the stock price keeps staying higher than a 50-day average, the price remains strong. On the other hand, if the price keeps cutting the average line, it means the market is not moving.
| Moving Average | Common Use |
| 20-day EMA | Short-term price movement |
| 50-day SMA | Medium-term trend |
| 200-day SMA | Long-term structure |
Relative Strength Index (RSI)
RSI gives a clear signal of the strength of recent price movement. The range goes from 0 to 100, highlighting whether there is growth or a fade in the price power.
Rather than predicting whether the price will turn around, it highlights that the price moved faster in comparison to the previous timeline.
For instance, RSI between 55 and 65 shows the price movement with appropriate strength. However, if RSI struggles to go above 45, the price movement remains weak.
Moving Average Convergence Divergence (MACD)
The MACD indicator signals a change in price speed (momentum) by analyzing the distance between a fast and slow average line. The MACD’s histogram (bars) shows the trend of whether the power is speeding up or down.
For example, if the histogram gets taller, the price power keeps on building up. When the bars keep on getting smaller, power keeps on slowing down with no major price movement.
Volume
Volume shows the number of shares active in the trading cycle with assured price movement. For example, if the price rises with strong volume, it showcases the involvement of more traders. If the price increases with low volume, it means there are fewer participants.
| Price Behavior | Volume Signal |
| Price rising & high volume | Strong participation |
| Price rising & low volume | Weak participation |
| Sideways price & falling volume | Loss of interest |
Bollinger Bands
Bollinger Bands signal if the market is busy or quiet. When the price movement is faster, Bollinger bands get wider. On the other hand, these bands start getting narrower with a slow price change. In simple words, narrow bands show the stable market, while wide bands highlight its active nature.
Volume Weighted Average Price (VWAP)
VWAP is nothing but the average price for most of the trades happening in the day. Since it’s based on daily trade updates, it is helpful for intraday analysis. VWAP serves the comparison between the current price and the actual day’s average.
For example, trading happens at a higher price if it gets above VWAP. On the other hand, the trading is likely to happen at lower prices for prices below VWAP.
Fibonacci Retracement
Fibonacci retracement taps the usual places where price takes a break after movement in one direction. These are helpful in understanding areas where the price is being stopped or slowed down. The most common levels are 38.2%, 50%, and 61.8%.
For example, if a stock goes up from $100 to $150 and further falls back to $125, this price will be near the 50% retracement level.
| Level | Meaning |
| 38.2% | Shallow pullback |
| 50% | Normal pullback |
| 61.8% | Deeper pullback |
Support and Resistance Levels
Support and resistance act as invisible walls where the market has stopped and turned many times before. Usually, these areas are ranges rather than single flat numbers.
For example, the area turns into resistance (ceiling) if the price keeps getting higher than $500. If it keeps bouncing near $420, the area turns into support (floor).
Conclusion
Hence, technical indicators can be very useful in understanding price behavior. While moving averages explain price direction, RSI and MACD highlight momentum. Similarly, Volume and VWAP explain activity, and Bollinger Bands/Fibonacci retracement showcase volatility.
For More Information: Download Stockyaari App Now
Standard warning: “Investment in securities market are subject to market risks. Read all the related documents carefully before investing.” Disclaimers: a. “Registration granted by SEBI, enlistment as RA with Exchange and certification from NISM in no way guarantee performance of the intermediary or provide any assurance of returns to investors.” b. “The securities quoted are for illustration only and are not recommendatory.”
This analysis is for informational purposes only. Please consult a SEBI-registered financial advisor before investing.
– Chandan Pathak
Equity Research Analyst, StockYaari